On April 7, Apica announced Ascent 2.16, a foundational platform release the company is positioning as the telemetry infrastructure enterprises need to support autonomous AI agents at production scale, making them Agentic-Ready. VMblog sat down with Andi Mann, Chief Product and Technology Officer at Apica, to dig into what ‘Agentic-Ready’ actually means, why legacy observability platforms are architecturally broken for AI, and what’s new in the release.
VMblog: Apica is calling this an ‘Agentic-Ready’ release. What does it actually mean for an enterprise IT team to be ‘Agentic-Ready,’ and why should they care right now?
Andi Mann: Let me unpack what we mean by ‘Agentic-Ready.’ An enterprise is Agentic-Ready when its telemetry infrastructure can support autonomous AI agents operating in production, not just in a POC lab. That means three things: First, your pipeline must be able to process, enrich, and govern telemetry before it hits a storage or analytics platform because AI agents need clean, contextualized data in milliseconds, not batch-processed output from the night before. Second, your metrics foundation has to handle extreme cardinality without blowing up your budget because AI agents spawn microservices, generate events at unpredictable volumes, and break general-purpose time-series databases. Third, your storage layer must make historical data instantly queryable and replayable because agents don’t just consume telemetry, they depend on it for audit trails and model evaluation.
This is especially critical today, because the enterprises experimenting with AI agents today are in a low-data environment. They haven’t seen what production-scale agentic workloads actually do to their observability infrastructure. When they do, the architectural decisions they make, or failed to make, will determine whether AI agents become a competitive advantage or a cost crisis. The time to build the right foundation is before the wave hits, not during it.
VMblog: You’ve cited figures suggesting AI agents generate 10 to 100 times more telemetry than traditional applications. Where does that number come from, and what does it mean in practice for engineering and SRE teams?
Andi Mann: Those figures reflect what we’re observing across our customer base as they move AI workloads into production, and it’s consistent with what Gartner and other analysts are beginning to document as well. The reason the range is so wide is that the multiplier depends heavily on the agent architecture: How many agents are running, how frequently they’re making decisions, how deeply they’re instrumented, and what kind of orchestration layer sits beneath them.
In practice, SRE teams are running into issues even with a single AI agent in production. Just one AI agent can generate more telemetry in an hour than an entire traditional application stack generates in a day. These agents are constantly logging decision traces, calling APIs, spawning subagents, writing intermediate outputs. Each of those actions generates telemetry events. Moreover, what was traditionally a human scale, scope, and speed of work, with Agentic AI is now happening at computer scale, scope, and speed. Now multiply that by dozens or hundreds of agents running concurrently in a production environment, and you have an exponential growth in data volume that legacy observability platforms simply weren’t designed to absorb.
For SRE teams, the immediate consequence is cost shock. Per-GB pricing models that were manageable for traditional apps become runaway expenses at AI scale. Teams start making tradeoffs they shouldn’t have to make, reducing visibility into critical systems to control costs. That’s exactly backwards from what an AI-driven enterprise needs.
VMblog: Legacy observability platforms have been the backbone of enterprise monitoring for years. What specifically is broken about that architecture in the context of AI, and why can’t enterprises just scale up what they already have?
Andi Mann: The core architectural flaw is what I call the ‘dumb pipe, smart platform’ model. Legacy platforms were built on the assumption that the pipeline is just a conduit; its job is to funnel everything into the platform as fast as possible, and the platform handles intelligence: Storage, indexing, analysis. That model made sense when telemetry volumes were manageable and predictable.
Agentic AI breaks that model in three fundamental ways. First, it breaks it on volume and cost, per-GB pricing models that seemed reasonable for traditional workloads become prohibitive when AI multiplies data volumes by 10 to 100x. You can’t just scale up a model that charges at every step: Ingest, store, index. Second, it breaks it on latency: AI agents need millisecond-level context for real-time decisions. Batch-processed data that’s already been ingested and charged by the time it’s actionable doesn’t meet that bar. Third, it breaks it on data quality: Agentic workloads generate fragmented, siloed, ungoverned telemetry at unpredictable cardinality. Legacy platforms have no mechanism to enrich, normalize, or govern data before it becomes expensive.
The reason enterprises can’t simply scale up existing platforms is that these aren’t capacity problems, they’re architecture problems. You can throw more money at a fundamentally broken model, but you can’t fix it that way. What’s required is inverting the architecture: put intelligence in the pipeline before data hits the platform, not after.
Here’s the uncomfortable truth: Legacy vendors aren’t going to solve this. Their business model depends on it staying broken. Per-GB pricing at every step, ingest, store, index, is a feature for them, not a bug. Inverting the architecture would mean cannibalizing their own revenue. That’s not a technology problem they can engineer their way out of. It’s an incentive problem they’re structurally incapable of resolving. It’s their architecture problem, just not one they’re incentivized to solve. You might call it their “precious.”
VMblog: Ascent 2.16 introduces synthetic monitoring data as a native stream within Apica Flow. Can you explain what that capability actually unlocks for teams building or running AI systems?
Andi Mann: I’m particularly excited about this because it solves a problem that’s genuinely new to the agentic AI era. Synthetic monitoring has traditionally existed in a separate silo from the telemetry pipeline. You run synthetic checks, automated probes that simulate user journeys, API calls, or end-to-end transactions, and you get pass/fail results in a monitoring dashboard. Useful, but isolated.
What 2.16 does is bring synthetic check results into Apica Flow as a live data stream, a first-class citizen in the telemetry pipeline alongside logs, metrics, and traces. The immediate benefit for traditional operations teams is that you can now apply full Flow pipeline capabilities to synthetic data: Filtering, enrichment, PII/PHI masking, volume governance, cost routing. Your synthetic signals go through the same intelligent pipeline as everything else.
But the more significant unlock is for AI-specific workflows. Synthetic probes generate known-result signals, you know what the correct output of a given check should be. That makes them uniquely valuable for AI validation. You can use synthetic telemetry streams as reference signals that AI agents compare against their autonomous decision outputs to detect drift, hallucination, or degraded performance before it affects real users. Synthetic transactions are ‘known knowns’ in a world of ‘unknown unknowns’, essentially delivering a built-in ‘source of truth’ for agentic systems running in production. No one else in the market is treating synthetics as a pipeline-native telemetry type with this kind of integration and depth of functionality.
VMblog: The release also includes real-time ROI visibility on pipeline rules. Observability teams aren’t usually thinking in terms of ROI dashboards. Why did you build this, and who is it actually for?
Andi Mann: You’re right that it’s unusual and that’s exactly why we built it. Because SRE and platform teams are being asked to control observability costs at the same time they’re being asked to expand telemetry coverage for AI workloads. Those demands are in direct conflict. Business owners are asking IT teams to make important technical decisions on data ingestion, decisions that will increase or decrease downstream ingestion costs significantly. Yet those same IT teams have had no visibility, and thus no effective control, into the potentially major financial impact of the choices they’re making. They’re engineering in the dark, yet they (or more likely, their VP or CIO) are still on the hook for potentially massive budget overruns.
What real-time ROI on pipeline rules does is surface cost impact at the moment a rule is written, not inferred from a billing report three weeks later. An SRE creating a filtering rule can immediately see the projected downstream ingestion and storage savings that rule generates. That transforms pipeline configuration from a purely technical exercise into a visible business lever.
Who is it for? It’s for the SRE or platform engineer who is on the hook for observability budget conversations they weren’t trained for; for the DevOps or engineering leader who needs to show the CFO that their team is actively managing AI-scale observability costs, not just reacting to them; for the VP of Ops to ‘arm’ their CIO with granular expense data before going into business-level budget meetings. At AI scale, where cost optimization decisions have to happen in real time, you can’t afford to be working from last month’s billing data.
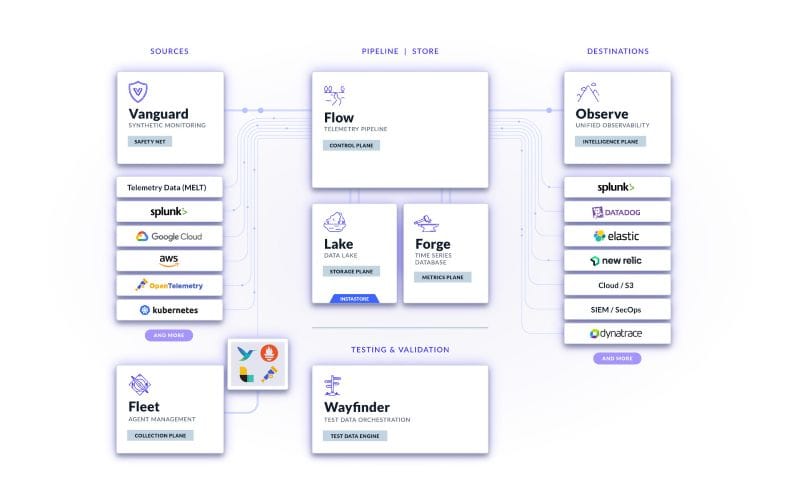
VMblog: Apica Ascent covers seven distinct product planes: Fleet, Flow, Lake, Observe, Forge, Vanguard, and Wayfinder. How do you think about the coherence of that product suite, and what’s the connective tissue that makes it a platform rather than a collection of tools?
Andi Mann: The connective tissue is a single architectural principle: Pipeline-first telemetry data management across the full data lifecycle.
Every plane is designed to solve a distinct problem that enterprises face when managing telemetry at scale: Fleet manages the agent infrastructure that collects that telemetry; Flow handles pipeline control and intelligent routing; Lake provides infinite, cost-efficient storage through our InstaStore technology; Observe delivers AI-powered analytics and LLM-native dashboards; Forge (formerly IronDB) handles high-cardinality metrics that break general-purpose time-series databases; Vanguard simulates real user and agent workflows to validate performance before issues reach production; and Wayfinder handles test data orchestration. Each plane can be adopted independently, but they’re designed to integrate and operate together seamlessly.
The advantage isn’t just architectural, it’s economic. Using the full Ascent suite, enterprises get up to 40% lower TCO than stitching together point solutions from legacy platforms. More importantly, these solutions can evolve as customers scale their agentic AI deployments, without requiring a rip-and-replace of their existing tooling. We support over 200 pre-built connectors for Splunk, Datadog, Elastic, and open-source components including OpenTelemetry and Prometheus. The point isn’t to replace everything customers have; it’s to give them a foundation that grows with them.
VMblog: The new SLO dashboard and RUM dashboard with AI-driven analysis are both included in this release. How do those capabilities tie into the broader agentic-readiness story or are they solving more traditional observability problems?
Andi Mann: Both, honestly. Let me take them separately.
The SLO dashboard is solving a traditional problem that surprisingly few observability platforms have solved well: Giving enterprise IT and SRE teams native tooling to define, track, and report against service level commitments in the same platform managing their telemetry pipeline. Most teams are doing SLO tracking in spreadsheets or disconnected tools, which creates gaps between what the business has committed to and what engineering can actually monitor. Consolidating that into Ascent is a real operational improvement for teams today.
The agentic angle is forward-looking but very concrete: AI-integrated workloads and autonomous agents are going to need to meet reliability standards before they’re trusted in production. The enterprises getting this right will define SLOs for their AI systems now, before those systems are in production, and use those SLOs as the reliability contracts that govern when an agent is allowed to act autonomously. The SLO dashboard is the tooling that makes that governance possible.
The RUM dashboard is similar. Real User Monitoring captures endpoint-level performance data from real devices and real sessions, data that most observability platforms don’t collect. The AI-driven analysis surfaces anomalies and performance patterns automatically, which is immediately useful for any team running user-facing applications. The agentic dimension is that as AI agents extend further toward the user, edge inference, personalized experiences, autonomous UI interactions, you need observability at that edge. RUM is the foundation for edge observability, and 2.16 is where we start building it.
VMblog: A lot of vendors are claiming their platforms are ‘AI-ready’ right now. What would you say to an enterprise evaluator who is skeptical, who’s heard this pitch from five other vendors this year and wants to understand what actually makes Apica different?
Andi Mann: Skepticism is healthy and the right response to it is specificity, not more marketing language. So let me give you three concrete things to put on your evaluation checklist.
First, ask any vendor claiming to be ‘AI-ready’ where intelligence lives in their architecture. Does the pipeline process, enrich, and govern data before platform ingestion or does all of that happen after data has already become expensive? If their answer is ‘after,’ their architecture isn’t designed for AI-scale volumes, regardless of what they call it. Apica’s pipeline-first architecture is the fundamental differentiator.
Second, ask them to show you cost impact visibility at the rule level. Not a billing dashboard, not a monthly cost report; show me the projected downstream savings the moment I configure a pipeline rule. If they can’t do that, they’re not giving your team the real-time financial control that AI-scale cost management requires.
Third, ask them to describe how their platform handles high-cardinality metrics from agentic workloads. AI agents generate telemetry with unpredictable cardinality that breaks general-purpose time-series databases and explodes per-series pricing models. Forge, our high-cardinality metrics engine, is purpose-built for this. Most observability platforms don’t have an architectural answer to it; they have a pricing workaround.
What makes Apica distinct is the breadth of what we’ve built specifically for this problem. Our product suite addresses distinct challenges in managing telemetry at agentic AI scale. It’s best-of suite of purpose-built products, each designed to address a distinct challenge in managing telemetry at agentic AI scale. Each product stands on its own and can be adopted where it solves the most pressing problem first. Other vendors are retrofitting AI onto platforms built for a pre-agentic world. Apica built each of these capabilities with agentic AI requirements in mind from the start and that’s a meaningful difference when you’re evaluating infrastructure you’ll be running for the next five years.
VMblog: Final question: What does the road ahead look like for Apica? Is Ascent 2.16 a destination, or a foundation for something bigger?
Andi Mann: Definitely a foundation, and I want to be explicit about what I mean by that, because I think it’s actually more meaningful than positioning it as a destination.
Ascent 2.16 is the infrastructure release that makes the next generation of Apica capabilities possible. The architectural performance improvements we’ve delivered aren’t visible on a feature slide, they’re substrate work that increases throughput, reduces latency, and prepares the product suite for the concurrency that agentic AI workloads will generate at production scale. We did that work now, deliberately, so that when enterprises are running hundreds of AI agents in production, Ascent is already hardened to handle it.
The capabilities we’re building toward are significant. Deeper integration between the telemetry pipeline and AI agent validation workflows. More sophisticated AI-driven analysis across Observe. Expanded Synthetic capabilities as enterprises start instrumenting their agent orchestration layers. Further advances in the Forge metrics engine for the extreme cardinality that agentic architectures produce.
But the broader point is this: The enterprises that will win with AI are the ones building the right infrastructure now before their AI deployments scale to the point where the wrong architecture becomes a crisis. Ascent 2.16 is the statement that Apica is the partner that gets them there. This is how you get Agentic-Ready before the wave hits, not after.
Apica Ascent 2.16 is generally available as of April 7, 2026. For more information, visit apica.io/demo.