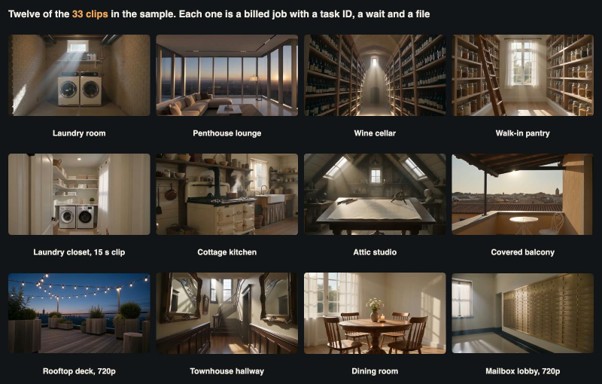
Twelve frames from the sample. For this article the images matter less than what each one cost the infrastructure: a task ID, a wait, a download and a stored file.
Most writing about video models judges the pictures. Operations teams get a different set of questions. How many jobs can be in flight at once? What does the latency distribution look like, not just the average? What happens when the network drops with paid work still running? How much storage and egress does a day of output create, and which line on the bill actually matters?
We wanted first-hand answers, so we treated a hosted video model as a backend dependency and measured it the way we would measure any other. The scenario is fictional: Harbourline Compute, a regional managed hosting provider we invented for this test, is asked to build a render queue for Keystead, an invented property listing service that wants a short silent preview clip for every room in every listing. The model is ByteDance’s Seedance 2.0 Mini (seedance-2.0-mini), the lowest-priced variant in the Seedance 2.0 family.
We ran 33 billed clips for $2.69 in generation fees, plus six deliberately invalid requests. That is a small sample, and we give the n beside every number. A few limits apply throughout. The client was one laptop in a single location, reaching the API through a local forward proxy. Submit and download timings therefore describe that path, not a datacenter network. The run took place on one evening, so it says nothing about daily or weekly patterns. We did not go looking for the provider’s concurrency ceiling. We also planned to measure clips with audio, and that part did not happen, for reasons covered in Test 7.
The job and the worker
The API is asynchronous. You POST a job, receive a task ID, then poll a task endpoint until the status is completed or failed. The result is a URL to an MP4, and the model page says that link is valid for 72 hours, so the file has to be copied to your own storage. That one fact shapes the design: the provider is a compute tier, not a storage tier.
Every clip used the same template, with the room changing per job:
{“model”: “seedance-2.0-mini”,
“prompt”: “Static wide shot of a compact home office with a birch desk, one chair and bookshelves, soft daylight, slow subtle dolly forward, no people, no text.”,
“duration”: 4,
“resolution”: “480p”,
“size”: “16:9”,
“generate_audio”: false}
The worker below is a simplified version of our Python runner, not the exact code we ran. The real one also handled threading, logging and downloads. The host is a placeholder, and the part worth copying is the order of operations: store the task ID before polling, and never repeat a POST automatically.
def run_job(job, store):
task_id = store.task_id_for(job.id)
if task_id is None:
try:
r = post(f”{BASE}/videos/generations”, job.payload)
except NetworkError:
store.mark(job.id, “submit_unknown”) # a human or a reconciler decides
return
if r.status != 200:
store.mark(job.id, “rejected”, r.body)
return
task_id = r.json()[“data”][0][“task_id”]
store.save_task_id(job.id, task_id) # durable before any polling
while not deadline_passed(job):
sleep(next_poll_interval(job))
try:
task = get(f”{BASE}/tasks/{task_id}”).json()[“data”]
except NetworkError:
continue # polling is free to repeat
if task[“status”] in (“completed”, “failed”):
return finish(job, task)
Test 1: baseline, one job at a time
To get a reference point we ran seven jobs strictly in sequence, each starting after the previous one had finished. All were 4 seconds, 480p, no audio, the shortest and cheapest shape the model offers. Each task record includes an actual_time field, and we use that as render time. We also recorded wall-clock time from the start of the POST to the poll that saw completion.
Render time ranged from 76 to 175 seconds, with a p50 of 109 and an interpolated p90 of 147. Wall-clock p50 was 113 seconds, so our overhead from submitting and from polling granularity was only a few seconds. With nothing else of ours running, the slowest job took 2.3 times as long as the fastest. That matters for everything that follows. The spread exists even without load from us, so a slow clip in a burst cannot automatically be blamed on the burst.
Two other observations. Across the 27 short clips in Tests 1 and 2, the submit call had a p50 of 1.7 seconds and a maximum of 10.6 seconds. All six jobs in one burst took an identical 5.7 seconds, which points at something shared in our own path rather than at the service. And the progress field jumped to 50 when a task entered processing and stayed there until it reached 100, so it cannot drive an ETA. Use your own historical distribution for that.
Test 2: bursts of 4, 6 and 10
Next we submitted groups of jobs simultaneously, letting each group drain completely before starting the next. Twenty jobs, each with a different room, all with the same parameters.

Each bar is one job. In the burst of 10, the fastest finished in 91 seconds and the slowest in 259.
Render times from the task records. With n of 4 to 10, the p90 is close to being the worst sample, so read it as a hint rather than a measurement.
All 20 jobs completed. There were no rate-limit responses and no failures, and every job reported processing within about 14 seconds of submission. The p50 barely moved: 109 seconds sequentially, then 117, 108 and 127. The tail did grow, with a p90 of 213 and a maximum of 257 in the burst of 10.
It is tempting to read that as load causing latency, but the data does not support it. The largest group simply took more samples from a distribution that already had a long tail, and the sequential run had already produced a 175-second job. Separating those explanations would take hundreds of samples at each level. What we can say is narrower: at 10 concurrent jobs from one API key we did not hit a limit, and we saw no obvious queueing penalty at the median.
For capacity planning, the useful figure is the batch finish time. Makespan was 140, 207 and 259 seconds for 4, 6 and 10 jobs. A batch finishes when its slowest clip finishes, so if a listing has ten rooms, the customer waits for the 259-second job, not the 127-second median. Publish clips as they arrive, or quote the p90.
Test 3: does render time follow clip length?
We then changed one parameter at a time: two 8-second clips, one 15-second clip and three 4-second clips at 720p.
Compare against the 76 to 257 second range of the 4-second clips: the differences here sit within the normal spread.
The 15-second clip rendered in 150 seconds, against a 109-second median for 4-second clips. The 8-second clips took 128 and 129. The 720p clips took 99, 109 and 109, which is the same as 480p at this sample size. The 15-second result falls well inside the range we saw at 4 seconds, so we are not claiming a scaling curve, only that render time did not appear proportional to output length.
Cost behaved differently. Billing was exactly linear in seconds and had a clean multiplier for resolution: $0.0653 for 4 seconds, $0.1307 for 8 and $0.2450 for 15 at 480p, and $0.1405 for 4 seconds at 720p, which is 2.15 times the 480p price.
Test 4: same seed, same bill
A render farm operator’s instinct is to deduplicate: if an identical request arrives, serve the cached output. We sent one request three times with the same prompt and seed 7001 to see what the service does.
All three were full jobs, and each was billed $0.0653. They were not the same file either. Average SSIM across the frames was 0.71, 0.74 and 0.75 between the same-seed pairs, while two clips of entirely different rooms scored 0.68 on the same measure. In one result the loft has round columns, in another a single thick pillar, and in the third none in the shot. That fits the model page’s own wording, which says the same seed gives similar but not identical results.
Two design rules follow. First, deduplication is your job: hash the normalised request, and if you have already rendered that hash, return the stored object. The service will not do it for you, and each repeat costs the full price. Second, a retry is not a replay. If a clip passes review and you later re-render it because the file was lost, you get a different clip. For anything a customer has approved, the stored object is the only copy that exists, so treat it as source data rather than as a cache.
Test 5: what polling costs
Polling can be studied for free by replaying recorded completion times. We took the 27 wall-clock times from Tests 1 and 2 and simulated several strategies.
A simulation over the sample. The last row waits 90 seconds, then polls every 15 seconds up to the three-minute mark, then every 30.
Our runner polled every three seconds and, because each request took another second or two through the proxy, it made a median of 24 GETs per clip. That was useful for measurement and wasteful in production. No job in the sample completed in under 88 seconds of wall-clock time, so polls in the first minute and a half learn almost nothing. A schedule that waits 90 seconds and then polls every 15, relaxing to 30 after three minutes, needs 4.3 GETs per clip on average and detects completion 8.3 seconds late, with a worst case of 27 seconds in this sample. Fixed 15-second polling needs more than twice as many requests for about the same freshness.
Polling load is arithmetic: in-flight jobs divided by the interval. At 600 jobs in flight and 15-second polling, that is 40 GETs per second, which is not much for a service but is enough that you should check your provider’s limits. The model page lists current per-second prices for each tier and the full parameter set for the Seedance 2.0 Mini API. That page does not state a request limit or mention webhooks, so ask about both before going to production. We tested polling only.
Test 6: where a bad request shows up
A queue needs to classify failure, and classification depends on where the failure appears. We sent six deliberately bad requests, once each.
Six probes, one sample each. The last column is the action we would take in the queue, not something the service tells you.
Only two were rejected synchronously with an HTTP 400: an unsupported 1080p resolution and a missing prompt. The other four returned a normal task ID and then failed. A duration of 3 or 16 and an unsupported aspect ratio of 5:4 failed within about a second, with an error message naming the parameter. A dead image URL took 17 seconds to fail. None of the six was billed.
Three practical points come out of that. Getting a task ID means the job was accepted for processing and does not prove it is valid, so success metrics must count completed jobs rather than submissions. Validate parameters client-side against the documented ranges (duration 4 to 15, the listed aspect ratios, 480p or 720p for this variant), since it costs nothing and saves a round trip. And do not build your retry policy purely on error wording: run a HEAD request against input assets before submitting, cap automatic retries at one or two, and send anything further to a dead-letter queue.
Test 7: the network failure we did not plan
The most useful test in this article was an accident. Partway through the run, our client’s connection stopped working. Polls hung or failed, and later requests through the local proxy failed with a TLS end-of-file error. We do not know the root cause. The task records show the provider’s work carrying on normally, so as far as we can tell the problem was on the client’s side.
Reconstructed from our logs and the created and completed timestamps on the tasks.
Three 720p jobs had been submitted at 19:42, and their task IDs were on disk before polling began. Polling saw them enter processing and then went blind. Our runner’s deadline expired after more than half an hour with the jobs still recorded as in progress. Meanwhile the server-side records show that all three finished in 99 to 109 seconds, around 19:44. At 20:30 a recovery script ran GET requests against the stored IDs, found all three completed, and downloaded them. Each was billed once, and all three files passed the integrity checks described below.
The next group was not so lucky. At 20:14 three submissions with audio enabled failed with that TLS error, so no task ID came back. The exception was raised while the connection was being set up, which strongly suggests the request never reached the service, but “strongly suggests” is as far as the client can go. We found no endpoint for listing tasks that would have let us confirm it, so the honest state of those jobs is “unknown until the invoice is reconciled”. We did not resubmit them. That is why this article contains no measurement of clips with audio.
The lesson scales up directly. A failed POST is an ambiguous event when each attempt costs money, so it should move a job into a distinct “submit unknown” state, separate from “failed”. Polling failures, by contrast, are harmless and can be retried indefinitely. The deadline on a job should mean “stop watching and reconcile later”, not “resubmit”. If our runner had treated that deadline as a failure and retried, we would have paid twice for clips that were already sitting finished on the server. With a 72-hour link lifetime, a reconciler that runs within a day has plenty of margin.
Test 8: storage, transcode and egress
Every clip came back as H.264 at 24 fps. The 480p tier delivered 864×496, not 854×480, and the 720p tier delivered 1280×720, so anything in your pipeline that assumes exact dimensions should read them from the file. Files ran slightly long, at about 4.04 seconds for a 4-second request.
The 480p output figure is the mean source size multiplied by the mean ratio from six transcodes. The 720p figure is a direct mean of three.
File size has more spread than most capacity models assume. With identical parameters, the 27 short clips ranged from 851 KB to 1,810 KB, with a mean of 1,200 KB. Two 8-second clips came in at 4.2 MB and 2.1 MB. Model storage on a mean, not on any single test file.
The delivered files are also encoded generously. Re-encoding nine clips with x264 at CRF 28, medium preset, gave outputs at about 19 percent of the source size at 480p (n=6) and 17 percent at 720p (n=3). SSIM against the source ranged from 0.956 to 0.990. The same nine clips went through SVT-AV1 at CRF 38 and preset 8. At 720p, AV1 averaged 11 percent of source, with SSIM between 0.945 and 0.990. At 480p it averaged the same 19 percent as H.264 at lower SSIM, and on some clips came out larger. CRF values do not map across codecs, so we would not call a winner from this.
The transcode stage turned out to be cheap: about 0.3 CPU-seconds per second of 480p video and 0.6 per second of 720p with x264, measured as user plus system time on an Apple M5 Pro laptop. Server cores will differ, so measure your own.
Test 9: integrity checks and what they miss
Each of the 33 files went through ffprobe, a full decode with errors logged, and ffmpeg’s blackdetect and freezedetect filters. Decode errors, black segments and freezes: zero across the board. These checks belong in the pipeline as a gate before a job is marked done, because a truncated download looks like a success to a queue.
But they only prove you have a playable video. They say nothing about whether it shows what was requested. We also looked at one frame from every clip, and none broke the “no people” or “no text” instructions in the frame we checked, although one frame per clip is a weak test of a whole clip. A generated room is also not the actual room, so a real listing service would need to label such clips clearly. Infrastructure cannot solve that, but it can record the prompt, seed, model and task ID for each object, so a clip can always be traced to its request.
What it costs, and where the money goes
| Item | Count | Billed each | Total |
| 4 s, 480p (Tests 1, 2, 4) | 27 | $0.0653 | $1.7643 |
| 8 s, 480p | 2 | $0.1307 | $0.2614 |
| 15 s, 480p | 1 | $0.2450 | $0.2450 |
| 4 s, 720p | 3 | $0.1405 | $0.4216 |
| Invalid-request probes | 6 | $0 | $0 |
| Total | 33 clips | $2.69 |
That works out to $0.0163 per second at 480p and $0.0351 at 720p. Those are the rates our account was billed, and they sit at the low end of the tiers on the model page, which lists $0.0163 to $0.0182 for 480p and $0.0351 to $0.0390 for 720p. Check your own tier. The figures exclude the narration for the video below.
Extrapolated from the sample using Little’s law for in-flight jobs. Nothing here was load-tested above 10 concurrent jobs, and a provider’s limits could change the picture entirely.
The table is a sizing exercise and not a forecast, and the peak factor of four is our own guess. Mean in-flight jobs are the arrival rate multiplied by the 130-second mean render time.
Now put prices on it. Using placeholder cloud rates of $0.02 per GB-month for storage and $0.08 per GB for egress (substitute your contract rates), the 10,000-clip day looks like this: $653 for generation, about $3.70 for 46 GB of egress, and about $1.40 per month to hold 69 GB of output. Transcoding costs about 3.5 CPU-hours per day. Generation outweighs delivery by more than 100 to 1 at 20 views per clip.
So the most valuable optimisation here is avoiding unnecessary renders, not storage or egress. A 5 percent re-render rate from sloppy retries costs about $33 per day at that volume, which is roughly nine times the egress bill.
Narrated walkthrough of the measurements, with clips from the sample.
A checklist for the production version
- Persist the task ID before polling. Our recovery depended on this one line.
- Give failed submits their own state. “Submit unknown” is different from “failed”, and it should go to reconciliation rather than back into the queue.
- Treat deadlines as “reconcile later”. A job you stopped watching may well have finished. Check by ID before doing anything else.
- Count completions, not task IDs. Four of our six invalid requests still received one.
- Delay the first poll. Nothing in our sample finished within 88 seconds, and a delayed schedule cut GETs by more than 80 percent compared with polling every 5 seconds.
- Plan around the tail. Median render was 109 seconds, and we saw 257. Batch features finish when the slowest clip does.
- Deduplicate on your side and keep the outputs. Same request, same seed, full price and a different file.
- Copy, gate and transcode immediately. The link expires, a decode check catches truncated files, and an 80 percent size cut costs a few CPU-seconds per clip.
The bottom line
As a workload, hosted video generation looks less like a media pipeline and more like a slow, expensive, non-idempotent remote procedure call. In our small sample, the service handled 10 concurrent jobs from one key without complaint, at a median of about 109 seconds and with a long tail. The hard engineering is on the caller’s side: tracking state through network failures, never paying twice for the same work, and keeping outputs that cannot be reproduced. Storage, egress and transcode are small numbers next to generation fees, at least until viewership gets very large. What this sample cannot tell you is how the service behaves at hundreds of concurrent jobs, at other times of day, or with audio enabled. Those are the tests we would run next, ideally from a datacenter network instead of a laptop, and with enough volume to make the p99 mean something.