By Pranith Kumar Reddy Myeka, Senior Database Consultant
After a decade of on-call rotations for production MySQL and Aurora systems, I’ve learned that the failures which wake you up at 3 AM are never the ones your runbook covers. Here’s what it actually covers.
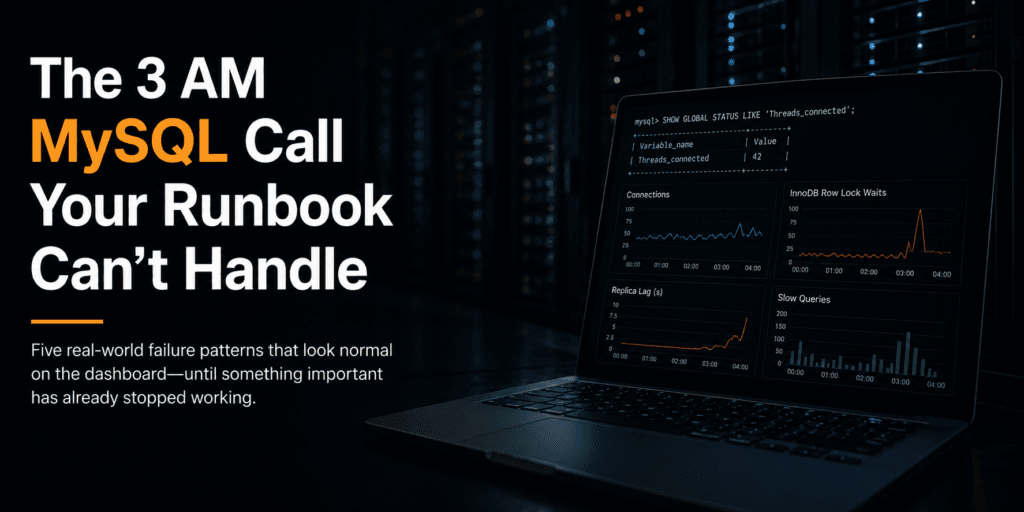
It’s 3:14 AM. Your phone goes off. P1. Database. You pull up the monitoring dashboard and everything looks — fine. CPU normal. Connections normal. Replication lag: zero. But orders have stopped processing for the last six minutes, and your on-call runbook is open in another tab, quietly failing to explain what you’re looking at.
I’ve been that person for over a decade. Production MySQL, Amazon Aurora, healthcare systems, high-volume transactional platforms. And the one thing I can tell you with certainty is this: the failure modes that actually wake you up at 3 AM are never in the runbook. The ones in the runbook are the ones you’ve already survived.
This piece is about five patterns I’ve seen repeatedly — the ones that look normal on the dashboard until something important has already stopped working. No vendor pitch. No tool recommendations beyond what’s already in your MySQL instance.
1. The Deadlock That Disappears From Your Slow Query Log
Most teams monitor for deadlocks by watching the slow query log or setting up alerts on innodb_deadlocks in Performance Schema. The problem: InnoDB’s deadlock detection kills one competing transaction almost immediately — often in under 50 milliseconds. That transaction never appears in the slow query log because it wasn’t slow. It was murdered.
What you’re left with is an application error — a rolled-back transaction — with no database-side evidence. Your application logs show “deadlock found when trying to get lock,” your monitoring shows nothing unusual, and the engineer on call spends 40 minutes trying to reproduce the issue in staging on a schema that doesn’t have the same concurrent write patterns as production.
What to actually look for: SHOW ENGINE INNODB STATUS\G contains a rolling buffer of the most recent deadlock — the exact transactions, the locks they held, the locks they were waiting for, which transaction was rolled back. The problem: it only shows the last deadlock. If multiple occur, earlier ones are gone.
Runbook Entry That Works
A cron job or monitoring agent that polls SHOW ENGINE INNODB STATUS every 60 seconds during elevated error rates and writes the LATEST DETECTED DEADLOCK section to a log file. Set this up before the incident, not during it.
The deeper pattern: deadlocks in production that don’t reproduce in staging are almost always caused by row lock ordering that depends on the specific arrival order of concurrent transactions. Application-level transactions that touch multiple tables need to access those tables in a consistent order across all code paths. One inconsistency, under sufficient concurrency, will eventually deadlock — it just won’t tell you when or why.
2. Aurora Failover: The 30 Seconds Your Application Isn’t Ready For
Aurora failover documentation says “typically 30 seconds or less.” What it doesn’t emphasize is what happens to your application during those 30 seconds. If your application opens database connections at startup and caches them — and most do — every cached connection to the previous writer endpoint is now pointing at a dead instance. Your connection pool is full of connections that will time out one by one, each throwing an exception, each consuming a thread.
“Aurora failover completes in 25 seconds. The application doesn’t fully recover for another 90 seconds. The monitoring alert fires 115 seconds after the actual failure started.”
The application-level behavior I’ve seen consistently: failover completes in ~25 seconds, but the application doesn’t fully recover for another 90 seconds while stale connections drain, exceptions propagate, and retry logic kicks in with exponential backoff configured for a different failure scenario.
Two things that make this survivable: first, your application must be using the cluster endpoint — not a cached instance endpoint — because the cluster endpoint automatically updates after failover. Second, set autoReconnect=true and meaningful values for connectTimeout and socketTimeout in your JDBC connection string. Values you’ve actually tested against a deliberate failover in a staging environment that mirrors your production connection pool size.
The runbook entry that matters isn’t “wait for failover to complete.” It’s “check application connection pool recovery, not database availability.”
3. The Replication Lag That Looks Like an Application Bug
A user updates their profile. Immediately after, a read operation returns the old value. Backend says: the database isn’t saving writes. DBA says: replication lag is under one second, everything is fine. Both are correct. The write went to the primary. The read went to a read replica. The replica hadn’t caught up yet.
Nobody wrote “do not send read-after-write operations to read replicas” in the architecture documentation, because it was obvious to the person who set up the read replica and not obvious to anyone else. Aurora replicas in standard configuration have typical lag under 100 milliseconds. Under write-heavy load, this climbs to several seconds. If your application routes reads to replicas without read-after-write consistency logic, any operation that reads immediately after writing to the same record is a potential consistency hazard. At low traffic it’s invisible. At high traffic it becomes a support ticket that says “sometimes the save button doesn’t work.”
The Monitoring Signal You’re Missing
CloudWatch metric AuroraReplicaLag tells you the lag per replica. Add this to your operations dashboard. The moment it climbs above 1 second, any read-after-write operations become unreliable. This is the metric that connects database behavior to application consistency failures — and most dashboards don’t have it.
4. The Query That EXPLAIN Can’t Explain
You have a query that runs in 40 milliseconds in staging and 40 seconds in production. You run EXPLAIN on both. Both show the same execution plan. Same index. Same estimated rows. Nothing makes sense.
What’s usually happening: the InnoDB buffer pool. In staging, your database fits almost entirely in memory. In production, it doesn’t. The index exists and MySQL uses it, but the index leaf pages aren’t cached — they’re on disk. Every index lookup that misses the buffer pool becomes an I/O operation. At 40ms in staging you’re doing 200 lookups per second. In production, each cache miss costs 4–8ms of disk I/O.
What EXPLAIN ANALYZE (MySQL 8.0+) gives you that regular EXPLAIN doesn’t: actual row counts and actual timing. If your staging and production actual row counts match but timing diverges by an order of magnitude, you’re looking at a cache miss problem, not a query plan problem. The fix isn’t a better index — it’s understanding your working set size relative to your buffer pool.
5. What a Useful On-Call MySQL Runbook Actually Contains
Most MySQL runbooks I’ve seen contain: how to check replication status, how to kill a long-running query, how to restart the service. These are things you already know how to do when you’re not panicking at 3 AM.
Decision trees, not procedures. “If replication lag is above X seconds AND error rate is above Y, check Z before doing anything else.” Not “check replication lag.” The procedure is obvious. The decision about what matters isn’t.
The exact commands, pre-written. Not “check InnoDB status” — the literal command: SHOW ENGINE INNODB STATUS\G. Not “look at Performance Schema” — the exact query: SELECT * FROM performance_schema.data_locks WHERE LOCK_STATUS = ‘WAITING’\G. At 3 AM, cognitive load kills response time. Remove every decision that doesn’t require your expertise.
Your environment’s baselines. “Connections are high” means nothing without knowing what high means for your specific instance. Your runbook should contain your normal ranges — connections, buffer pool hit rate, replication lag, active transactions — so the person on call can answer “is this abnormal” without calculating it under pressure.
The things that are almost never the database’s fault. Connection exhaustion is usually application connection pool misconfiguration. Read-after-write inconsistency is usually routing logic. Slow queries that weren’t slow last week are usually schema changes or data distribution shifts. Your runbook should help the on-call engineer rule out the application layer before going deep into database diagnostics.
The Pattern Behind All of These
Every one of these failure modes has the same structure: the database is behaving correctly, and the surrounding system — the application, the connection pool, the monitoring setup, the runbook — has an assumption baked in that the database violated. The database didn’t break. The assumption broke.
The goal of a good database reliability practice isn’t eliminating failures. It’s eliminating the time between “something is wrong” and “I know what I’m looking at.” That gap is where 3 AM incidents become 3 AM disasters. Your runbook can’t cover every failure mode you haven’t seen yet. But it can make sure you’re looking at the right signals when an unfamiliar one appears.
##
ABOUT THE AUTHOR

Pranith Kumar Reddy Myeka is a Senior Database Consultant with over a decade of production experience in MySQL, Amazon Aurora, and cloud-native database reliability engineering. He holds the AWS Certified Data Engineer – Associate credential and has published research in IEEE on database systems. He writes about database reliability, schema automation, and the operational realities of running MySQL at scale.
IEEE Publications:
LinkedIn: