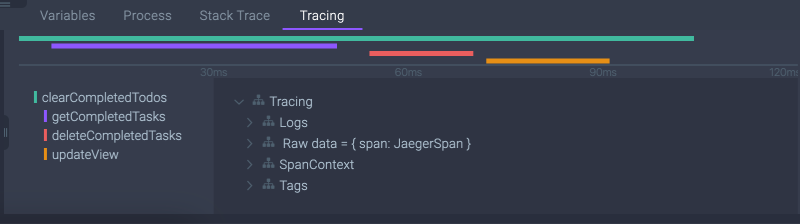
Rookout has built a really cool Tracing Timeline for developers, that brings together debugging data and distributed tracing data. To learn more, VMblog spoke with Oded Keret, the product manager at Rookout.
VMblog: Rookout is pioneering the next generation of debugging — can you explain what some of the typical challenges are for developers trying to debug complex, distributed systems?
Oded Keret: Traditional debugging methods such step-by-step debugging are practically impossible to use in cloud-native environments. There is never a single server to connect to and debug, as the environments are dynamic, and containers or pods or serverless functions spin up and down on the fly.
Many developers find themselves falling back to even more traditional debugging methods, namely – logging, printf debugging, or what is often called “caveman debugging”. Log debugging in distributed systems brings its own set of challenges – developers now need to consider logging cost, performance impact, and they need to invest in solving the complexity of collecting and shipping logs to a central log aggregator. Making things worse, Log debugging means you have to add log lines to your code, roll the changes out to production, and wait a significant amount of time before you can read the newly printed information.
VMblog: What is it about Rookout’s platform that is technologically groundbreaking?
Keret: Rookout gives developers the friendly experience of a friendly step-by-step debugger, and the ability to add a log line on the fly. Rookout does this by implementing a technology we like to call Non-Breaking Breakpoints. When setting a Rookout Non-Breaking Breakpoint, a developer is de-facto adding a log line to the code, without waiting for a release. The log line is added using bytecode manipulation, and fetches full data about the local state of the code, including local variables, stack trace, opentracing information and more. This data is fetched on the fly and streamed into the developer’s favorite observability platform, or to an IDE-like web interface, giving a friendly debugger experience.
VMblog: How is what you offer different from Observability?
Keret: Rookout complements existing Observability platforms by fetching additional, dynamic code-level data to an existing Observability pipeline. Rookout expands Observability, or the ability to see the state of the application from the outside, into Understandability – the ability to fully understand the state of the application from inside.
By providing full access to code-level data, including variable values and the state of the stack trace, and by enriching existing views with additional Tracing and Profiling information, providing context and a deeper insight into the state of the application, Rookout revolutionizes the way engineering teams consider their existing troubleshooting and application monitoring methods.
VMblog: And finally, you’ve integrated with OpenTelemetry and built what’s called Rookout’s Tracing Timeline — Can you explain the benefits and how it works?
Keret: Rookout automatically integrates with the OpenTelemetry project, making it simple to hook into Jaeger, Zipkin, Lightstep and other tracing solutions. When a Rookout Non-Breaking Breakpoint is hit in an application, tracing data such as span, logs, tags and more are collected. This newly collected data is then visualized into a detailed tracing timeline, side by side with data that is natively collected by Rookout, such as local variables, stack traces, metadata and more. This gives developers an extra layer of tracing context integrated with their debugging sessions, thus enriching the troubleshooting flow and making developers more efficient.
##