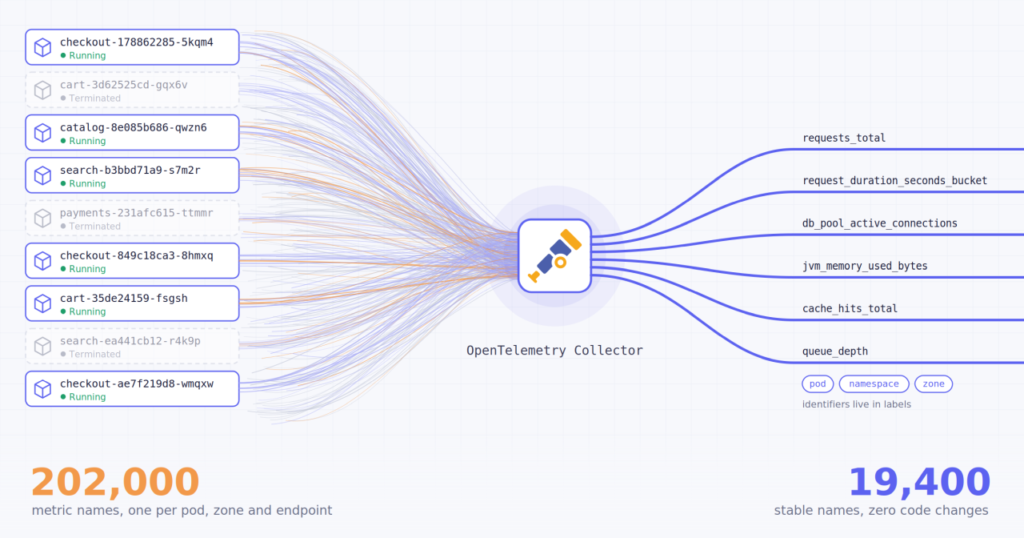
How OpenTelemetry Collector rules took one Kubernetes estate from 202,000 metric names to 19,400, and what changes in your PromQL and alerts.
Ask any platform team about metric naming and someone eventually says it: “Yes, we know it isn’t best practice, but our code encodes every label as a separate metric name. Can we collapse them back without rewriting every service?”
You can. We, OpenObserve, recently did this for a large US-based, consumer platform on Kubernetes. Its observability tenant held about 202,000 distinct metric names, and roughly 585 new ones appeared every hour. Using only the OpenTelemetry Collector’s filter and transform processors, we brought it down to about 19,400, around a 90% reduction, without touching a line of application code. Here is the pattern, the traps, and what it does to your queries and alerts.
How labels end up in names
Older emitters, such as StatsD, Graphite or Dropwizard-style hierarchical metrics, had no labels. The only place to put “which pod” or “which endpoint” was the name. Bridge that into a label-based backend and dots become underscores, but the identifiers stay put.
Kubernetes turns this from untidy into unbounded. Every rollout creates a new ReplicaSet hash and every pod gets a random suffix, so every deploy, restart and scale-up mints new metric names. The rule worth remembering: the number of metric names should scale with what you measure, not with what you run.
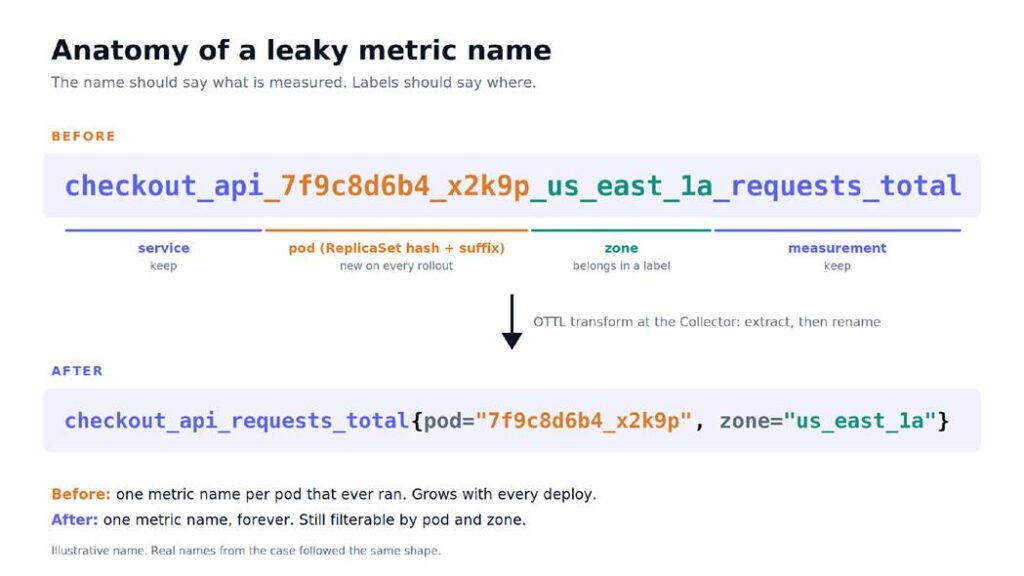
Figure 1. The identifiers move out of the name and into labels. The name stops changing; you can still filter by pod and zone.
The estate we worked on had pod names, regions, zones, endpoints, HTTP methods, connection pools and even JavaScript asset hashes baked into names. Listing metric names took seconds, autocomplete was unusable, and dashboards leaned on regexes over __name__ that broke with every deploy.
The bar
Before changing anything, we agreed a fix had to:
- Need zero changes in application code.
- Keep filtering by pod, zone or endpoint wherever someone actually does that.
- Run beside the existing pipeline, so the team could compare before committing.
- Stop new names from appearing, not just clean up the old ones.
Step 1: Drop events disguised as metrics
Some names carried timestamps or UUIDs, so every event minted a brand-new name. Those are events, not metrics. The filter processor drops them first, before any regex work runs.
filter/drop_junk:
error_mode: ignore
metrics:
metric:
– ‘IsMatch(name, “.*[0-9]t[0-9]{2}:[0-9]{2}:[0-9]{2}z.*”)’
Step 2: Fold identifiers back into labels, one family at a time
The transform processor runs OTTL, the Collector’s small language for editing telemetry in flight. For each family of names, we wrote a pair of statements: one extracts the identifiers into attributes, the other rewrites the name.
transform/normalize_names:
error_mode: ignore
metric_statements:
# shape: svc_resource_<resource>_<method>_<series>
– context: datapoint
statements:
– merge_maps(datapoint.attributes, ExtractPatterns(metric.name,
“^svc_resource_(?P<resource>[a-z0-9]+)_(?P<method>[a-z0-9]+)_”),
“upsert”) where IsMatch(metric.name,
“^svc_resource_[a-z0-9]+_[a-z0-9]+_(request|response|total)(_|$)”)
– context: metric
statements:
– replace_pattern(metric.name,
“^svc_resource_[a-z0-9]+_[a-z0-9]+_(request|response|total)(_.*)?$”,
“svc_resource_$$1$$2”)
Three details matter. Extract before you rename, because the rename destroys the original name. Guard each extract with where IsMatch, so one family’s regex never touches another’s. And write $$1, because the Collector expands $ as an environment variable. We validated every rule offline against a dump of real names before deploying: the two largest endpoint families matched 4,637 of 4,637 and 2,209 of 2,209 names. All of this ran on Collector contrib 0.122.0.
Step 3: Peel stacked suffixes into a stat label
Many names ended in stat tokens, sometimes two deep, like svc_latency_ms_min_p95. Two passes of the same rule, writing first to stat and then to stat_inner, turn it into svc_latency_ms{stat=”p95″, stat_inner=”min”}. A single pass into one label would overwrite the first token with the second.
Step 4: Clean up history, once
After a few days of clean data, we deleted the old names through the backend’s admin API. Everything ran on a separate Collector pipeline, so the existing pipeline to the incumbent backend never changed, and the team compared both side by side before committing.
Three traps worth avoiding
- Don’t peel real histogram suffixes. If _sum and _count are in your suffix list, genuine Prometheus histograms lose their triad and histogram_quantile() returns nothing. Keep _bucket, _sum, _count and _total in the name.
- Labels are not free. Promoting an identifier moves its cardinality from names to series; it doesn’t delete it. If nobody filters by a JavaScript asset hash, drop the attribute instead of promoting it.
- Renames silence alerts. An alert on an old name doesn’t error; it returns nothing and never fires. Inventory every rule, rewrite it, add an absent() guard, and shadow-run old and new alerts before switching.
What changes in your queries
The pattern is always the same: a regex on the metric name becomes a plain name plus a label selector or a by (…) clause.
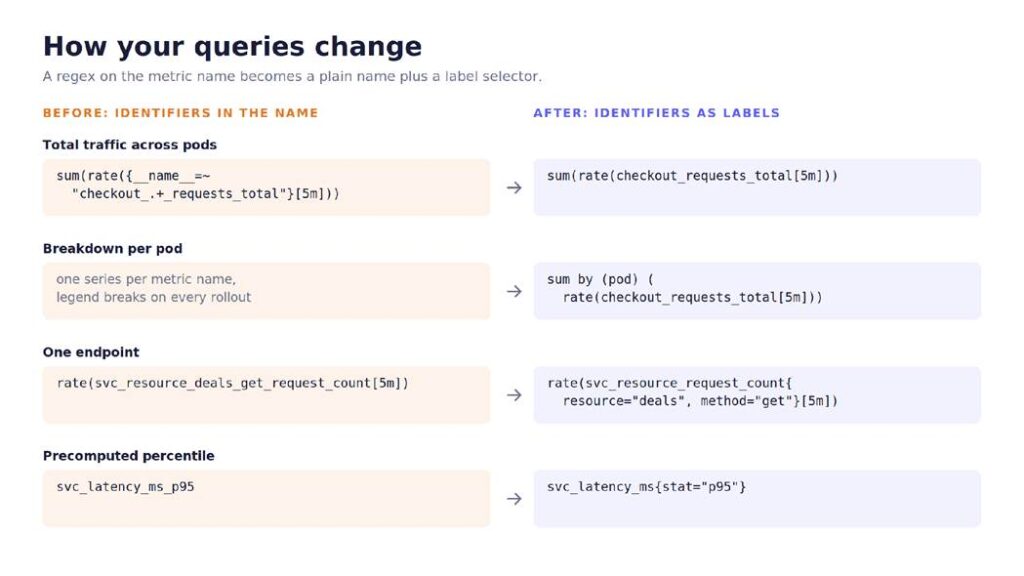
Figure 2. The same questions, before and after normalization.
The bigger win is the queries that were impractical before. topk(5, sum by (resource, method) (rate(svc_resource_request_count[5m]))) now ranks every endpoint in one line.
What changed
| Before | After | What it means | |
| Distinct metric names | ~202,000 | ~19,400 | About 90% fewer |
| Name listing and autocomplete | Several seconds | Under a second | Observed in the UI, not a benchmark |
| Fixed per-name overhead | 202k names | 19.4k names | ~10x less, derived from name count |
| Application code changes | n/a | 0 | Everything happened in the Collector |
The overhead row is derived from the name count, and the responsiveness row is what we saw in the UI, so treat both as a rough shape rather than a benchmark.
Keeping it clean
New services and emitters keep arriving, so treat normalization as a policy rather than a one-off project:
- Keep naming rules in version control, with a CI check that lints a fresh name dump for pod hashes, UUIDs and URL fragments.
- Track the distinct metric-name count as a metric, and alert on a step change after a deploy.
- Sweep names with no stored data on a schedule, as a safety net.
Start with one number
You can check your own exposure against any Prometheus-compatible API:
curl -s “$PROM_URL/api/v1/label/__name__/values” | jq ‘.data | length’
If that number grows every week while your service count doesn’t, your labels are living in your names. Fold them back at the Collector, where one team can fix it for everyone. I’d like to hear which naming patterns have been hardest to untangle in your estate.
KubeCon + CloudNativeCon is taking place in Salt Lake City, Utah from November 9 to 12. Register Now!
##
ABOUT THE AUTHOR

Manas Sharma, works across solutions engineering and developer advocacy at OpenObserve, helping platform teams run observability at scale on Kubernetes.